
-


- Business insightas never before
- See results in daysthan months

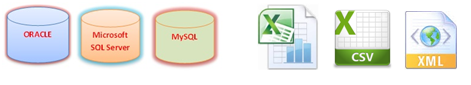
- All data sources covered including spreadsheets
-

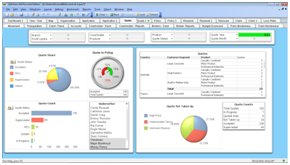
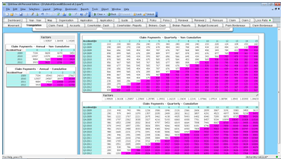
- Dashboards to analyse performance
- Analytical charts to discover trends
- Detailed Reports to Increase efficiency
-

- Marketing
- Underwriting
- Claims
- Finance
- Operations

-

- We have done the scripting – Just plug your data
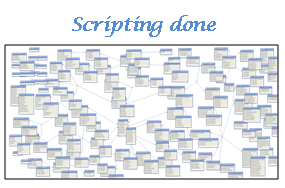
- Save up to 80% of development effort
- Dedicated support – On-site and Off-site

To know more about our QlikView Service.. please click here..
Powered with QlikView, the new generation business intelligence tool, Radiant
BI provides analysis, reporting and dashboards to every insurance business domain
from marketing to underwriting, claims to reinsurance, accounting to actuarial analysis.
Radiant BI enables business to uncover hidden trends and make discoveries that drive
innovative decisions. Radiant BI boasts a flexible and comprehensive data model
that can be tailored to fit individual company needs. Created by specialists
with proven insurance experience, Radiant BI provides immediate results by cutting
down time and effort spent on requirements gathering, development, UAT and maintenance
Key Features
- Cuts down development time and effort to less than 80% of a normal BI project
- Encompass all Insurance modules
- Comprehensive set of Dashboards, Analytical charts and Reports.
- intermediary formats such as data warehouses or cubes are NOT required
- Can consolidate data from various sources including spreadsheets to give a full picture
- Dedicated on-site and off-site support
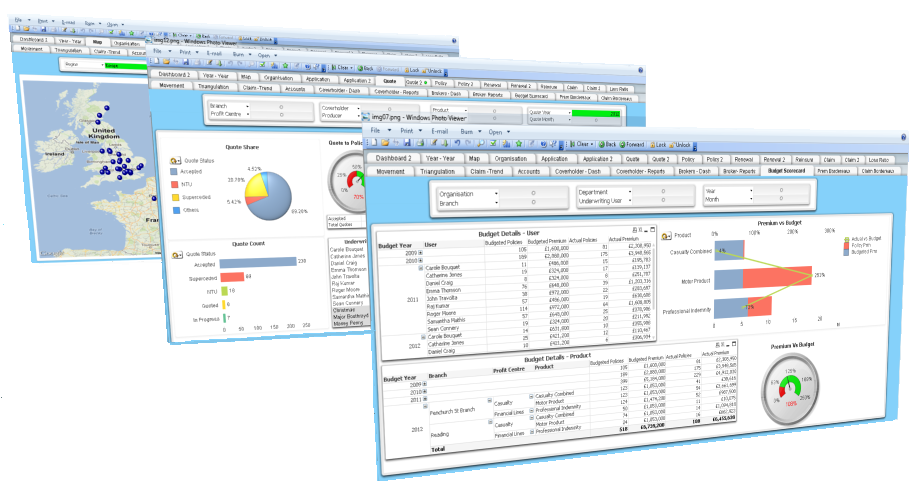
Dashboards
With Radiant BI, discover performance trends and analyse Key Performance Indicators
(KPI) across the organisation in terms of:
- Customers gained, lost and their reasons
- Quote conversion, Renewal retention
- Coverholder/Broker performance
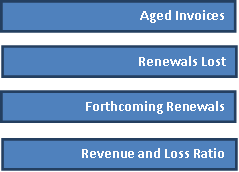
- Revenue and loss ratio for different time periods.
- Year-to-Date Sales and Revenue against budget
- Branches, departments, underwriters etc.
- And many more….
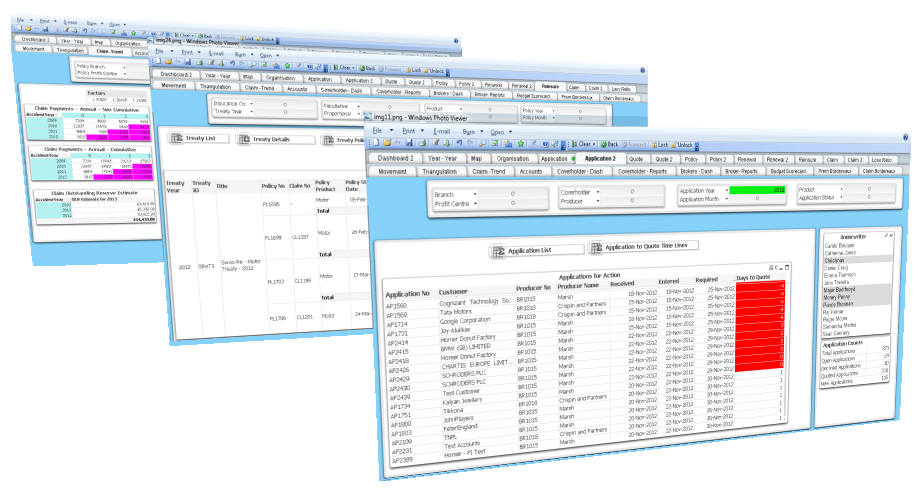
New Business
Analytical charts and reports display graphical summary and detailed information
of:
- Applications and quotes based on status, products, brokers etc.
- Work in progress lists to prioritise work accordingly.
- Hit ratio of an application moving from quote to policy.
- Loss of opportunity by customer segments, brokers etc.
- Rate deviation by underwriters
- Application of endorsements.
- And many more….
Policy Servicing
Graphical charts and detailed financial information are included to show policy
dimension by product,policy status, brokers, customer segment, branch, department,
underwriter and many more... Detailed reports are included to show:
- Policy Coverages and their premium breakdown by transaction types
- Forthcoming renewal list
- Renewal retention, lost premium, non-renewal reasons etc.
- Commission analysis, cancellation list etc.
- And many more…
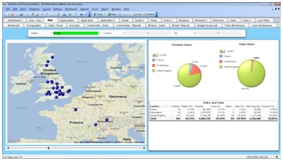
Claims Management
Among others, analytical charts and detailed reports in our claims section provide:
- Detailed claims information by product, broker, customer segment, status etc.,
- The cause of claim and what percentage each classification represents.
- Geographical spread of claims using google map along with detailed information
- Reserves, payments, recoveries, outstanding, net position etc.
Accounts
Reports in Radiantare designed to help accounts personnel with their day to day
activities. Reports include:
- Aged invoices showing outstanding balance by days by brokers
- Detailed list of invoices, cash receipts and payments.
- GL chart of accounts
- Trial Balance and Account postings by individual transactions are included.
- And many more….
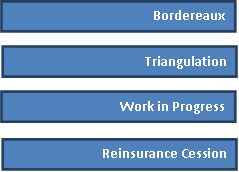
Reinsurance
Among other reports, this section includes
- Reports showing reinsurance cession for proportional and non-proportional treaties detailing Coverage premium, ceded premium, claim paid and claim ceded.
- List of treaties, their details, and policies attaching to treaties.
Bordereau and PMDR
- Standard Lloyd’s bordereau reports i.e. written, paid, claims, exposure can be generated from Radiant BI and exported as excel files with just a click of a button.
- Where necessary, Performance Management Data Return (PMDR) can also be produced out of Radiant BI when sufficient information is available.